Lightcurve Construction
Included in Data Release 3 is a user-searchable database of lightcurves generated by linking sources extracted across multiple oservation epochs.
To access the lightcurve database with usage instructions, follow this link.
Methodology
Lightcurves are constructed using the IPAC source-matching/relative-photometry pipeline on intervals of typically two months using all the calibrated epochal survey data acquired and archived to date. The process first matches all the SExtractor-based catalog sources to those in its overlapping reference-image catalog on a field, CCD, filter basis to create an internal matchfile product. The reference-image objects provide target positions to "seed" the source-matching across multiple epochs. However, source-matching also occurs exclusively across epochs, with no reliance on whether a reference image object was detected. For the latter, the matched epochal apparitions are defined as "transient" detections and are flagged as such (with transient_flag = 1 in the database). For lightcurves tied (or seeded) to a reference-image detection, transient_flag = 0 in the database.
Following the source-matching step, the cleanest, least-variable sources (across all epochs) are identified and used as absolute anchors for input into the relative photometric refinement step. Photometric zero-point (ZP) correction factors are computed for each overlapping epochal image using a global least-squares fitting method. These correction factors are stored in a look-up table and used to refine the photometry of all sources in the matchfile product. Application of these correction factors to the raw calibrated pipeline photometry can improve the relative photometric precision to a few to several millimags at R or g <~ 15 (see plots below for before and after). Note that the raw calibrated (SExtractor) photometry in the lightcurve database (before any ZP-correction) is labelled mag_auto while the corrected photometry is labelled mag_autocorr.
For more information on source-matching and relative photometric calibration (or refinement of the absolute photometry), see Chapter 3 in Levitan, D. 2013, PhD Thesis (Caltech).
 |
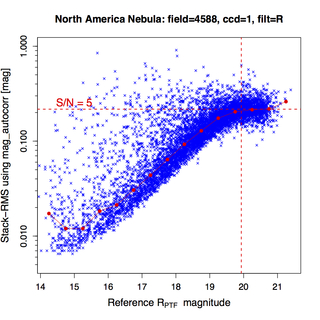 |
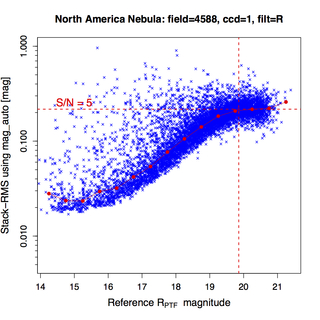
| Figure 1: RMS in repeated photometry vs magnitude for a CCD falling on the North America Nebula field: Left - using uncorrected photometry in the lightcurve database; Right - using corrected photometry (with relative ZP-corrections applied). The lower-envelope in these plots can be used to estimate the "sensitivity" to variability, or rather, the significance of a suspect variable source at a given magnitude. The S/N=5 limit is shown for guidance. It's important to note that this particular field is close to the galactic plane. It has a high nebulosity, complex background, and high source-confusion. The RMS estimates shown here are therefore larger than those for fields at higher galactic latitudes (see Figure 2) [click plot to enlarge]. | |
 |
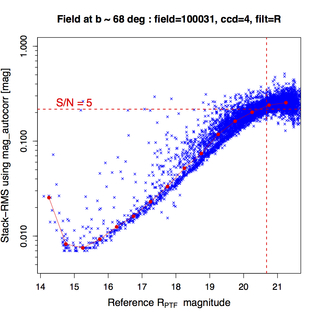 |
| Figure 2: RMS in repeated photometry vs magnitude for a CCD falling in field 100031, with galactic latitide ~ 68 deg. Left - using uncorrected photometry in the lightcurve database; Right - using corrected photometry (with relative ZP-corrections applied). The lower-envelope in these plots can be used to estimate the "sensitivity" to variability, or rather, the significance of a suspect variable source at a given magnitude. The S/N=5 limit is shown for guidance. The RMS estimates shown here are more typical of fields at higher galactic latitudes [click plot to enlarge]. | |
Scope and Content for DR3 Lightcurve Database
The lightcurve database contains a subset of the epochal data acquired from March 1, 2009 to January 28, 2015. It does not contain measurements from all epochal data contained in the image/catalog archive. A significant fraction of low quality data in the galactic plane were omitted. In order to retain a large enough span of epochs with sufficient sampling over this period, only nights where the number of galactic plane exposures (with |b| < 15 deg) was <= 20 were retained. The total number of nights included in the lightcurve database for DR3 is 1,010. This comprises approximately 65% of all nights containing R or g-band data over the course of the PTF/iPTF survey. The lower quality data will be rexamined and reprocessed, and included in a future data release.
Here's a listing of all the epochs and CCD-based images represented in the Lightcurve Database for DR3.
Statistics for DR3 Lightcurve Database
- Number of individual R-filter images from which sources where extracted (from 11 and sometimes 10 functional CCDs per camera exposure): 1,711,664.
- Number of individual g-filter images from which sources where extracted (from 11 and sometimes 10 functional CCDs per camera exposure): 319,082.
- Number of independent observation epochs (camera exposures) in R: ~ 158,000.
- Number of independent observation epochs (camera exposures) in g: ~ 29,500.
- Number of sources extracted from individual images (loaded into the Sources Database Table): ~ 9.18 billion.
-
Number of individual objects with lightcurves (loaded into the Objects Database Table): 598,975,024
- number of lightcurves tagged with transient_flag = 0 (tied to a reference-image detection): 307,059,401.
- number of lightcurves tagged with transient_flag = 1 (not tied to a reference-image detection): 291,915,623.
Cautionary Notes
- Not all epochal data that can be queried from the image/catalog archive will have measurements in the lightcurve database (see above).
- It is possible for the lightcurve and source databases to contain measurements extracted from more recently reprocessed image data for which products were not updated in the image/catalog archive. Older image/catalog files may be present in the archive. At this time, this applies to night IDs (nid values) 1854, 1861, 1874, and 1889 in the listing of epochal products used to build the lightcurve database. Their corresponding processing IDs (pid values) will not match those in the lightcurve and source databases.
- The reference image used to seed source matching for a specific field, CCD, filter may have been from an earlier processed version and may not correspond to that available in the archive.
- The reference image used for generating lightcurves for a specific field, CCD, filter may be missing in the archive.
- Lightcurves will only be present for sources at sky locations (defined by a specific field, CCD, filter) that have an associated reference (co-add) image. Some locations had too little coverage (too few epochs) to create a good quality reference image.
- There is no guarantee that all epochal images had accurate instrumental calibrations, for example, some images may have bad astrometric and/or photometric calibration solutions. These will impact the lightcurve measurements.
- Related to the previous point, bad astrometric solutions will lead to unmatched sources across epochs. Therefore, some epochal measurements will be missing entirely, even though they fell on images who's catalogs were used to construct the lightcurve database (see full list of images).
- The magnitude measurements that include relative ZP-corrections (see above) are labelled mag_autocorr, while those that do not (but are still absolutely calibrated) are labelled mag_auto.
- The magnitude error estimates magerr_auto do not account for errors in the relative ZP-corrections, nor systematics in ZP estimates across epochs. The magerr_auto estimates are SExtractor based and only capture pixel-flux uncertainties on a per-source, single-epoch basis. Figures 1 and 2 above can be used to validate and perhaps re-adjust the magerr_auto estimates. Uncertainties in the mag_autocorr measurements will be properly computed in future.
- Any lightcurve with ngoodobs < 4 will have all its corresponding "time-collapsed" metrics set to "null", while any lightcurve with nbestobs < 4 will have all it's "best"-prefixed metrics set to "null".
- The lightcurve statistics are calculated on a larger sample of data than is included in DR3. Due to technical limitations it was not possible to recalculate the statistics on the exact subset of data included in DR3. Accordingly the number of observations reported (e.g., nobs) will be in general larger than the number of points returned by the lightcurve service, and the statistics will be different than the values computed on the points returned. Users requiring exact correspondence between the lightcurve points and the statistical values are advised to recompute the required statistics. For bulk selection (e.g., variability cuts using RMS), however, the reported statistics should be adequate.